The title might surprise quite a few when they see the stock that has been mentioned below.
However, one basic shortcoming of following charts only over the past few years can tend to mislead into believing that this stock is not doing anything for the last 5 years.
The stock is Reliance Industries Limited. This stock was the darling of investors once upon a time, especially in the Gujarati community, who will still be loyal to it. (I have also heard that there are some traders, who never go short in RIL, as a mark of respect to the tremendous wealth it has generated for them in the past).
The duration of a trade is directly proportional to the time frame on which one studies the chart !
In my view, to get a long term view of this chart, one should not look at the performance of the stock price only over the past 5 years. It is clear as shown below, that this stock has been sideways over the past 5-6 years (weekly chart below)

A very long term monthly chart also does not show much promise and it can also be termed bearish (monthly chart below).

The above monthly chart is on a linear scale. The same monthly chart on a LOG SCALE now gives a different picture as shown below:
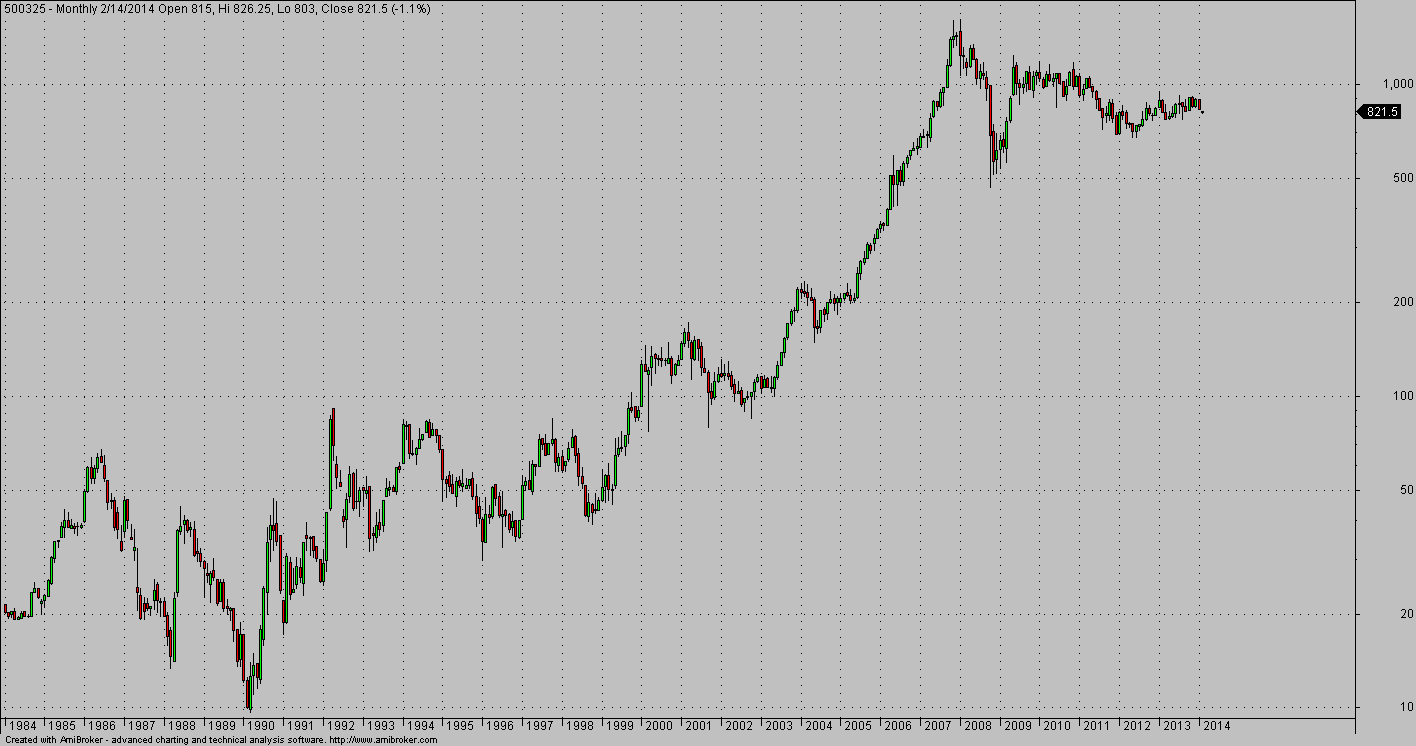
The monthly chart has a support of a trend line (blue) near 780, and a very long term trend line support near 550 - 570.

A look at the yearly chart of RIL:

In my view, after the steep rise till January 2008, the stock is only consolidating, and might do so till it touches the long term trend line. However, since nothing can be said with certainty, it is better to buy some quantity for the long term near 780- 790, and then finally near 560 - 570.
A text book pole - pennant formation can also be seen on the long term chart, and if the support at 550 - 560 holds, I would expect this stock to give a breakout for a target of minimum 3000 over the long term.
I am sure, people will be afraid to buy this stock especially due to all the negative news regarding gas prices among others coming in the media on a regular basis.
However, old timers in the stock market will be aware that this stock thrives on a dose of bad news, and the best time to buy this stock is when the news get really bad.
If one believes in the India growth story and the fact that our stock market is headed for much higher levels in the next 3-5 years, I firmly believe RIL will be one stock to watch out for.
However, one basic shortcoming of following charts only over the past few years can tend to mislead into believing that this stock is not doing anything for the last 5 years.
The stock is Reliance Industries Limited. This stock was the darling of investors once upon a time, especially in the Gujarati community, who will still be loyal to it. (I have also heard that there are some traders, who never go short in RIL, as a mark of respect to the tremendous wealth it has generated for them in the past).
The duration of a trade is directly proportional to the time frame on which one studies the chart !
In my view, to get a long term view of this chart, one should not look at the performance of the stock price only over the past 5 years. It is clear as shown below, that this stock has been sideways over the past 5-6 years (weekly chart below)
A very long term monthly chart also does not show much promise and it can also be termed bearish (monthly chart below).
The above monthly chart is on a linear scale. The same monthly chart on a LOG SCALE now gives a different picture as shown below:
The monthly chart has a support of a trend line (blue) near 780, and a very long term trend line support near 550 - 570.
A look at the yearly chart of RIL:
In my view, after the steep rise till January 2008, the stock is only consolidating, and might do so till it touches the long term trend line. However, since nothing can be said with certainty, it is better to buy some quantity for the long term near 780- 790, and then finally near 560 - 570.
A text book pole - pennant formation can also be seen on the long term chart, and if the support at 550 - 560 holds, I would expect this stock to give a breakout for a target of minimum 3000 over the long term.
I am sure, people will be afraid to buy this stock especially due to all the negative news regarding gas prices among others coming in the media on a regular basis.
However, old timers in the stock market will be aware that this stock thrives on a dose of bad news, and the best time to buy this stock is when the news get really bad.
If one believes in the India growth story and the fact that our stock market is headed for much higher levels in the next 3-5 years, I firmly believe RIL will be one stock to watch out for.


